The One Metric That Proves College Websites Are Worth the Investment
Revenue-producing business metrics that prove an impact on the bottom line are non-existent among web marketing teams at most colleges and universities. Here's how to change that.
Zero.
That’s the number of revenue-producing business metrics most college and university web marketing teams use to prove their impact to the school’s bottom-line. Zero. Zilch.
It’s not that they don’t want to prove value. It’s just that colleges’ data systems are byzantine, isolated, and hard to connect. Plus, there aren’t universally accepted goals for a college website. Showing impact is hard.
We hate that. Despite defining business goals at the start of every of our 50+ college and university web projects, we are often unable to demonstrate – with numbers – that we met these business goals. We resort to soft goals: the sites looked better, were easier to use, better focused on prospective student needs, and told a better story about the school.
That was until we honed in on one metric that every admissions department measured: the rate of admits who matriculate after having visited the campus.
Admissions staff at colleges and universities universally know this number. They use it to illustrate the impact of the personal touch the admissions staff provides during campus visits.
The rate is nearly the same at every school – 50%. That is to say of the admits who have visited campus, 50% of this sub-group will matriculate.
How Do I Use This Metric to Prove a Revenue Return?
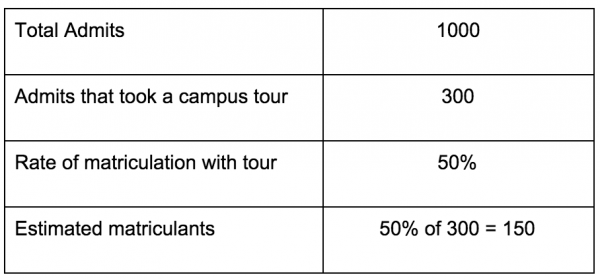
Here’s how it works. Let’s say a school accepts 1,000 students. Of these 1,000, three hundred have been to campus for a tour during their decision-making process. Using the 50% rate of matriculation, the admissions group would predict 150 of the 300 admits will matriculate.

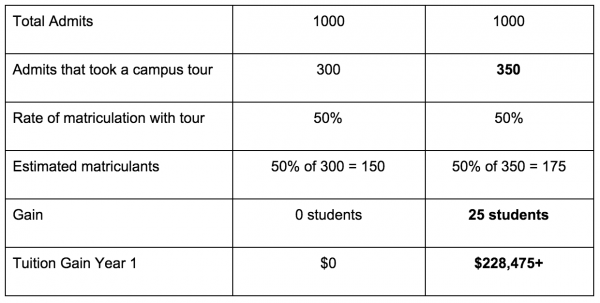
Now, let’s think about what would happen if we could use the website and digital marketing efforts to drive up the number of campus tours. Let’s say through advertising, website personalization, improved user experience, and overall optimization we increase the number of campus visits overall, resulting in an additional 50 students in the admit pool. Here’s what this would look like:

With a 50% rate of matriculation, we’ve demonstrated an increase of 25 students. Based on an average tuition of $9,139 in 2014-2015 for a state school, in the first year alone the school will net an incremental $228,475. The rate of return for a private 4-year school swells to $780,925.
You can't claim that! What to do about naysayers.
While these numbers are impressive, we’re realists. We understand lots of people will start to argue that the web marketing team can’t attribute all of revenue to the team’s hard work.
Maybe. But, that’s not the point. The point is that you’re suddenly (and subtly) having a different conversation. Did you see it? You’re debating about revenue, dollars, and impact. And that’s the beauty of a model like this; it opens a dialogue that leads lets web teams say, "If we can't claim all of this success, let's talk about another measure." This model opens up a deeper partnership with enrollment that fosters the integration of systems for more advanced tracking and measurement.
It opens up a conversation with the finance office too. Suddenly, you’re now speaking the CFO’s language – dollars and return. With a model like this, web teams can position the website as investment with measurable return rather than a sunk capex cost. (Incidentally, this can only help your conversations at budget time.)
College web marketing teams need to start changing the conversation. They need to think about themselves as being in the lead generation business. They must get comfortable with data, models, and proving returns. By changing the conversation to focus on results, there is suddenly a bigger goal for the website and all the work that goes into maintaining it. With data driven goals in place, the web marketing team can make decisions based on data, not political whim. Their work is more focused, and they become the experts. Isn’t that a game changer? Isn’t it more meaningful?
Whoa, this seems complicated. Why not just count applications or info requests?
Good question. Two reasons. First, the campus visit is usually the only task that is exclusively completed on the website. Prospects can “request info” via the mail, College Board, or at events. Prospects can start the application process from lots of different points: the common app, third-party sites, etc. Second, a prospect considering a campus visit is showing commitment to a school. To use a sales term, these prospects are more qualified than students just requesting information. These prospects are going to invest time and money to come see a campus. A campus visit is a conversion. It’s the equivalent of taking a test drive in the car buying process.
OK, I want to get started proving revenue return. What do I do?
How does it work? Simple — let’s walk through the steps to start measuring.
-
E-mail your admissions director and ask for the rate of matriculation for admits who have taken a tour. Go ahead, we’ll wait. If you can’t get the number, we recommend using 50%.
-
If you don’t have one, set up a campus visit form on your website. Remember, keep it short and friendly. Here’s a good example from Washington State University – it’s got a nice calendar interface too.
-
Integrate calls-to-action throughout your site to drive prospects to the campus visit form.
-
If you’re using Google Analytics, set up a conversion goal for the Thank You page of the campus visit form. This will give you direct access to the data to know the number of tours scheduled; you won’t need to go ask for this data from admissions.
-
Establish a baseline by collecting the data from completed forms and/or campus visits from the previous 12-24 months.
Set-up done. Now how do I improve conversions?
These five quick steps will prepare you to start tracking campus visit conversions. Your next move is to think about how to increase the number of campus visits. Here’s what you should do:
-
Use a tool like Optimizely to A/B test different forms.
-
Start promoting campus visits in e-mail and social media channels. Be sure to use link tracking so that you know where all the traffic is coming from.
-
Improve your content around campus visits. Too often the campus visit form is a wall of text, lots of details, lots of instructions. Think about how to entice prospective families. Use photos, video, and forms at conversion points.
-
Run a user test — call in three to six students and have them complete the campus visit form.
-
If you have a multi-step form, set-up funnel tracking in Google Analytics and analyze the data to determine where prospects drop off in the process.
Got Your Own Goal to Track?
Great. These steps and processes can be used to set up tracking for almost any process goal that you want to measure. The most important thing you can do is find ways to start getting data that shows that you changed a behavior of a prospect. If you can prove you’re making a difference and influencing the decision of prospects, then you are on your way to building a model to demonstrate the ROI of your website.
Good luck and let me know about your success — tweet me at @jason_smith.